

Intro
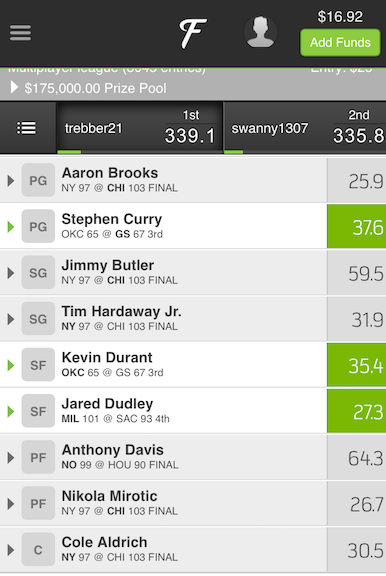
Many of you may not know this, but I absolutely LOVE fantasy sports, specifically NBA. I’ve been participating in leagues for the last 4 years, but it wasn’t until this past year that I tried my luck on daily fantasy NBA on fanduel.com. I had some success (had the top score one night out of 8,000 people), but I knew I could do better. Basketball is known as the most consistent sport out there, so why was I not winning every single night?
Well, for one thing I wasn’t doing my own research. I was getting my analytics from some other websites who either A) came up with their own predictions, or B) just went off of their biased opinions of players. What I wanted to do is take the guessing game completely out of all of this so what I’ve done is downloaded stats from 2012 - 2014 and will attempt to create my own nightly predictions and win some money next season!
The night I won.
NBA data…how nerdy are you?
Some people may like to scrape their own data, but I’ve heard you can get in trouble for this, and for a small fee I was able to download the data from www.nbastuffer.com. This data is csv, and CLEAN. Very nice, but we would need to make some changes. The main thing I had to add in to this data on my own was the position that the player played. This was fairly easy to find and with some excel magic we now had a data set! Example below:
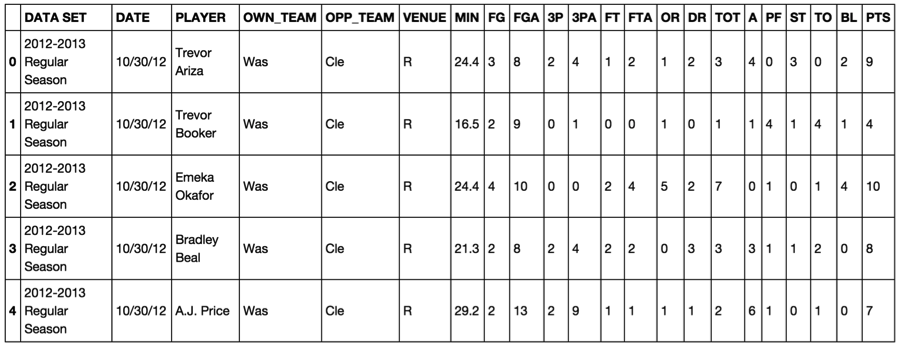
As you can see, there is the data set name, the player, position, their team, who they played, whether it was a home or away game, and all their stats for the night. The goal of this analysis is to see based on what we know about the opposing team, what the player’s position is, and how many minutes they will receive, can we predict all their other stats? Ultimately, can we predict the value that they will bring on fanduel on any given night? Stay tuned!
Calculating fanduel points
This section will go over how fanduel points are calculated. The more fanduel points a player receives, the more valuable they are. Different stats are worth different amount of fanduel points. Official scoring is below:
PTS = 1 per point
TOT = 1.2 per rebound
A = 1.5 per assist
BL = 2 per block
ST = 2 per steal
TO = -1 per turover
As you can see, points are just worth themself, where as 1 rebound in the game is actually worth 1.2 fanduel points and 1 block is worth 2 fanduel points. Turnovers hurt your fanduel points.
Ok enough of that, here is some quick code to calculate the fanduel points!
### IMPORTS ###
import pandas as pd
import numpy as np
# just doing the basic arithmitec from above
# set axis=1 to conduct row wise operations
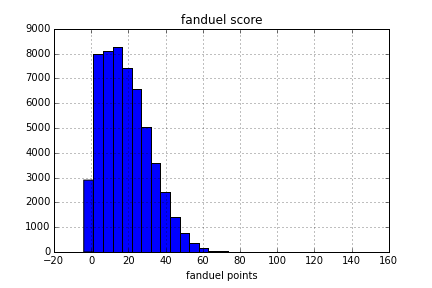
df['fanduel_score'] = df.apply(lambda x: x['PTS'] + x['TOT']*1.2 + x['A']*1.5 + x['BL']*2 + x['ST']*2 -x['TO'], axis=1)Here’s a graph of the distribution of fanduel scores throughout the last two seasons.
Let’s make some predictions
Ok now we have a fanduel score, and we’ve seen from above that most scores are in the 5 - 30 point range. Definitely a left skewed distribution. For now I’m going to leave all of these variables alone and see what we can get off of the non-transformed score.
First thing’s first, we have to prepare our data for analysis. We have some unordered categorical variables such as the opposing team, whether it is a home game or not, and the position the player plays. In order to make this data useable for analysis, I’ve chosen to create dummy columns for each. Code below:
home_dummies = pd.get_dummies(df.VENUE, prefix='venue')
position_dummies = pd.get_dummies(df.Position, prefix='position')
team_dummies = pd.get_dummies(df.OPP_TEAM, prefix='Opponent')

data = pd.concat([df, home_dummies, position_dummies, team_dummies], axis=1)
Now we can see below if we view the data frame that their are columns for each team, each position, and whether home or away.
Results
Now our data is prepared, it’s time to start predicting! All models will be evaluated based on their R^2 score.
First I’ll start with our trusty old friend, linear regression. After splitting our data into training and test, it performs as follows:
Linear Regression: 0.691
Pretty good! Up next, a random forest regressor with 1,000 trees:
Random Forest: 0.667
Hmm, not as good, perhaps a grid search tuning session is in order. Next up I tried an SVM with a linear kernel and an rbf kernel:
SVM - Linear: 0.686
SVM - RBF: 0.700
Winner!! SVM with an RBF kernel seems to perform the best out of the box. I’m pretty pleased that 70% of the variation in fanduel scores can be explained by this basic model. The SVMs ran in under one minute so some grid search tuning will be done in the future.
For how I actually conducted this analysis, please visit my github repo for this project: fanduel_nba
Conclusion
I literally started looking at this data today, so no groundbreaking analysis just yet. But in the next few weeks I plan to add in data on specific player matchups (aka how good of a defender they are, or how offensively talented they are), vegas lines (higher vegas lines are expected to score more fanduel points), and other player efficiency ratings.
UPDATE: By transforming the fanduel_score variable via a log transform, I was able to improve the R^2 to 76%!
Here’s some of the coefficients from the linear regression analysis so far, just for fun!
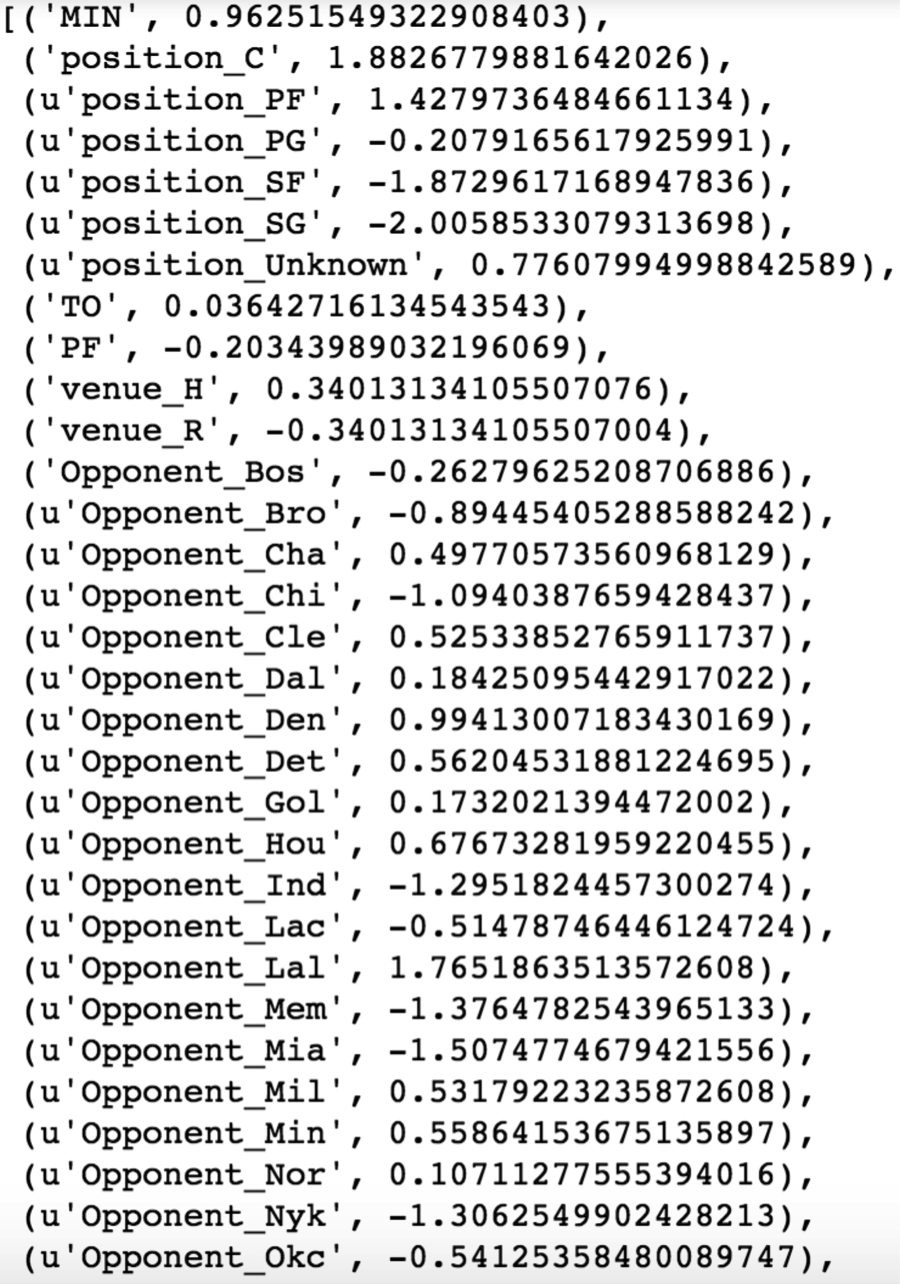
~ Trevor