

Post in progress
I’ve been quite busy since my last post about the FDA open data api! I downloaded over 50 gb of FDA data and explored all three ‘Drug’ options (Labeling, Adverse Events, Recalls). There are over 4 million adverse events, 70k drug labels, and 7k recalls to analyze so it’s kept me quite busy! In this post, I’m going to discuss how I analyzed the FDA approved drug labels to look for labels that need to be strengthened / improved based on the reactions being reported for the drug. Getting this data into a DB and cleaning it was a process in itself and I’ll speak more about that towards the bottom of the post after the results section.
Overview of processes for this project: 1. Use API to extract data 2. Clean JSON data 3. Clean warning labels (lemmatize) 4. Extract topics from warning labels via LDA 5. Cluster labels based on similarity of topics 6. Use One Class SVM to identify anomalies
Why FDA drug labels?
When I was in university, I woke up one day with serious neck pain and had to see the Doctor immediately because the pain was unbearable. The Doctor prescribed me some pain killers, told me to take one right now, and then as needed. About 15 minutes later, I started to sweat, the room was spinning, and next thing I know my roommate is repeatedly asking me “Are you OK??”. I had passed out from this drug…an unpleasant adverse reaction to this painkiller. When I reviewed the warning label later that day, there was no mention of this as a side effect.
When looking over the drug label data, this story came to my mind and I thought “I wonder how many drug labels out there don’t truly show the potential side effects?” This post explains how I went about finding these drug labels.
How to analyze the label text?
I wanted to analyze the actual warning label text of an FDA drug label, so how was I going to identify anamolies based on the text alone?
I tried two techniques to analyze the warning label text. The first was to transform all the warning labels into a matrix of term frequencies. I tried both TF and TF-IDF representations of the data, but neither worked particularly well for the analysis I was conducting. The TF-IDF works well when trying to find unique words in a block of text and I used it on my last project. However, for warning label text, many of the same words were going to be repeated and I did not want to alienate those words.
Next, I had recently come across topic modeling using Latent Dirichlet Allocation and thought it would be more appropriate. This technique works to extract all the various topics present in your text. Applied to my data, each warning label would have a score for each topic ranging from 0 to 1. A zero meaning that topic isn’t present at all in the label, and a 1 meaning that topic is fully contained in the label.
To do this, there is an open source package called Gensim.

I won’t go into detail about topic modeling, but I will share the basic process (seriously, a whole post could be about this section). Firstly, I had to clean all the warning label text. To do this I used NLTK to lemmatize all the words and bring them to their base forms. Next, I ran the LDA algorithm on my 70k drug labels. I set it to find between 5 and 50 topics, incrementing by 5 topics each time. There is no literature on selecting the optimal number of topics, so I had to eyeball this one and see which split made the most sense. I chose 25 topics because it seemed to be the sweet spot identifying useful topics. Lastly, I now had to run the LDA algorithm on every single warning label. The outcome was a 70,000 row matrix with 25 columns. Each column represented a topic and the score was from 0 to 1. Now that my text data was represented in terms of numbers, I could now analyze it!
Finding similar warning labels
The next step in finding anomalies was to group the warning labels together based on whether or not they discussed similar topics. For example, upon doing this, one of my clusters contained drugs that were related to estrogen. The reason these appeared in the same cluster was because they discussed the same topics in their warning labels.
During this project, I found that clustering is an art. When it comes to clustering, there is no one size fits all answer. The best answer for your project depends on what you’re trying to accomplish. In my case, I wanted the clusters to be as meaningful as possible and I did not have a constraint about how many clusters I could use.
Keeping the size of my data in mind, I decided to optimize between KMeans, Agglomerative, and DBScan clustering techniques. DBScan unfortunately wasn’t working, so I just stuck to the first two techniques. Both clustering algorithms required me to specify the correct number of clusters, and having no prior knowledge, I had to do some testing. I would try 2 clusters, analyze the sihouette score, try 3 clusters, analyze silhouette score, and keep repeating. The goal was to maximize the silhoutte score which can be thought of as a measure of distance in the cluster as well as the distance to the next cluster. The higher score the better. A graph of silhouette scores for agglomerative clustering is below:
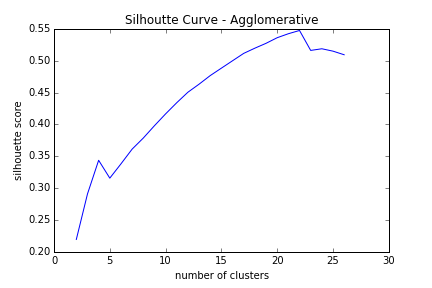
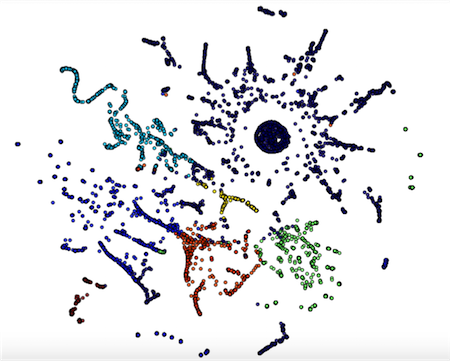
As you can see from above, the score increases the more clusters I use, until we get to about 22 clusters. From that point, the silhouette score starts to decrease, hinting that we’ve found a maximum. To show this visually, I used KMeans clustering with 7 clusters, transformed the data into 2 dimmensions using TSNE, and colored the data points by their cluster assignment. You’ll see that generally, points close together are in the same cluster. There are some outliers, and these are the points we are after! :)
Detecting outliers
I am currently tuning a one class SVM to detect outliers! So far I’ve detected some outliers using groupby and visually inspecting the data, but of course it would be much easier to do this programmatically. More to come!!
Conclusion
Well this has certainly been a fun, yet challenging project! I really enjoy working in this space and will continue to mine the FDA data for more interesting insights.
I’d like to thank my instructors Bo Peng and Aaron Schumacher for their guidance on this project! They helped me find new techniques when I was getting stuck. Also, thanks to all my peers at Metis whom I bounced ideas off of. You know who you are! :)
Data cleaning
In order to get this data cleaned, there was a lot of scripts that were run. Each would pull 500 documents from my MongoDB, clean it, then save it as a CSV. The data is nested JSON and some fields are not always present, so these cleaning scripts check to see whether every field is present for a label, and extract it if it’s present. I’ve put some code below to give an example of how I went about tackling such nested data. Please check out my github for how I cleaned the recalls, adverse events, and labels data! Feel free to use it for your own FDA Open data projects. Have fun :)
### IMPORTS ###
from pymongo import MongoClient
import pandas as pd
import numpy as np
import pprint
from collections import Counter
import matplotlib.pyplot as plt

### SETTING UP ENVIRONMENT ###
# make sure mongod is running
client = MongoClient()
labels = client.drugs.drug_labeling
events = client.drugs.adverse_events6
enforcement = client.drugs.enforcement

### FLATTEN THE DATA ###

""" the data is nested JSON and I'd like to get it tabular so I'm going
to flatten it with the function I've created below.  This one is extracting
the data related to the patient and the drugs they have in their system. """

def flatten_patients_data():

    """ this function reads in the data from mongodb in chunks because
    the size of the data is too large to fit into memory.  I read in each
    iteration and then extract the data I need and save to csv"""

    """ this is how we are going to iterate through the mongodb cursor """

    print "here we go............."
    for i in range(0,30):
        tracker = i

        """ num and num_500 are how I am going to iterate through the
        cursor by taking slices """

        num = i*500
        num_500 = num + 500
        cursor_events = events.find({})[num:num_500]
        documents_events = []
        map(lambda x: documents_events.append(x['results']), cursor_events)
        # for j in cursor_events:
        #     documents_events.append(j['results'])
        print "done with documents step: " + str(tracker)

        """ there are 100 items stored in each document so now I have to
        iterate through each document and pull out the specific item.  One
        document contains 100 items... """

        data_events = []

        for k in documents_events:
            map(lambda x: data_events.append(x), k)
            # for l in k:
            #     data_events.append(l)
        print "done with data step: " + str(tracker)

        print len(data_events)

        """ now we have to start to flatten out the data.  The data is
        nested JSON so I'm only going to extract the parts that I need.
        There are two levels of keys that I'll be extracting from...
        first and second """

        # test is the list of lists we are going to append to
        test = []

        # headers are the headers of the list of lists file
        headers = ['safetyreportid', '@epoch', 'receivedate', 'serious', 'transmissiondate', 'medicinalproduct', 'drugcharacterization']

        # the list of our keys that aren't nested
        first = ['@epoch', 'receivedate', 'serious', 'transmissiondate']

        # the list of the keys that are nested
        second = ['medicinalproduct', 'drugcharacterization']
        keys = ['medicinalproduct', 'drugcharacterization']
        test.append(headers)

        """ the goal is to create a list of lists. sometimes a key does
        not exist...if it doesn't, then we skip that row """

        documents_events = []


        for i in data_events:
            for j in i['patient']['drug']:
                if all (k in j for k in keys):
                    row = []
                    row.append(i['safetyreportid'])
                    row.extend((i[m] for m in first))
                    row.extend((j[n] for n in second))
                    test.append(row)
                else:
                    pass
        print len(test)

        """ now that we have our data flattened out into list of lists
        it is time to save it to a csv file """

        data_events = []

        import csv

        with open ("patientsv3"+"_"+str(tracker)+".csv", "wb") as f:
            writer = csv.writer(f)
            try:
                writer.writerows(test)
            except:
                print "data not good..."
        print "done with csv step: " + str(tracker)

flatten_patients_data()
~ Trevor