

Recently, I was looking for an interesting data set to hone my classification machine learning skills. I wanted to solve a problem that could actually have some real world business impact and I wanted the data set to be LARGE. Well, I got my wish when I stumbled upon this data collected by Julian McAuley
This data set contains Amazon review data from May 1996 - July 2014 and contains 83 million reviews! Such an incredible data set with a wealth of information. This post will detail how to read in the data and do some basic processing / exploration, so let’s get started!
Firstly, so what kind of data is this? Well, it is user review data for Amazon products, and an example of the web page version of this data is below:

As you can see, the review starts by stating how many people found the review helpful (56 of 63 in this case), how many stars out of five the user rated the product, a summary, user name, date, and finally, the actual review text.
Ok, so we have JSON data for 83 million reviews, so what do we do with it?? Well, what I did is just downloaded one products data and took a 500k row sample. If you use python, you can read in the data as follows:
def parse(path):
    g = open(path, 'r')
    for l in g:
        yield eval(l)

obj_reviews = parse(reviews_data)
for i in obj_reviews:
    reviews.append(i)

df_reviews = pd.DataFrame(reviews)
Ok, great, now we have the reviews data in the pandas dataframe, but now what to do with it? Well there’s a few things that I did first. I casted the ‘unixReviewTime’ column to a datetime object which helps us later. Also, you’ll notice that the ‘helpful’ column contains values that look like this ‘[56, 63]’. The first value represents the number of helpful votes, the second represents overall votes. This data is useful to us, but not in this form, so let’s create some additional columns!
def creating_basic_features():
    df_reviews['helpful_votes'] = df_reviews.helpful.apply(lambda x: x[0])
    df_reviews['overall_votes'] = df_reviews.helpful.apply(lambda x: x[1])
    df_reviews['percent_helpful'] = df_reviews['helpful_votes'] / df_reviews['overall_votes']
    df_reviews.review_helpful = np.where((df_reviews.percent_helpful > .7) & (df_reviews.helpful_votes > 5), "Yes", "No")
You’ll notice that I also created a percent helpful column which just divides the number of helpful votes by overall votes and I also created a binary column which states if the review is helpful or not. So far, this column has some arbitrary cutoffs, but I’m working to find a fair way to calculate if a review is helpful or not…for now, this metric serves us well.
Let’s look at some histograms of these distributions:
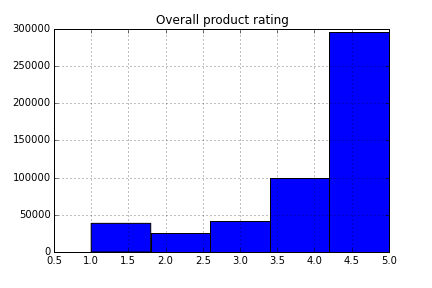

Ok, so we can see that reviews are right skewed towards 5 star ratings with each previous star rating getting less and less reviews. Perhaps some bias in who submits reviews? Or a large percentage of fake reviews? Next, we notice that there’s a number of reviews that are not helpful at all, a low dispersion of helpfulness from 10% helpful all the way to 90% helpful, and then a significant amount of reviews that are 100% helpful. Hmm, quite weird. Let’s explore this more in the follow up blog post, let’s keep moving along with how to analyze the review data.
Next, it was time to start doing some basic analysis on the reviews. For this, I have chosen to use a package called Text Blob. I’ll show the code below, then explain what each feature is doing:
# if you haven't installed it yet, just run 'pip install textblob'

def create_textblob_features():
    from textblob import TextBlob
    df_reviews['polarity'] = df_reviews['reviewText'].apply(lambda x: TextBlob(x).sentiment.polarity)
    df_reviews['len_words'] = df_reviews['reviewText'].apply(lambda x: len(TextBlob(x).words))
    df_reviews['len_sentences'] = df_reviews['reviewText'].apply(lambda x: len(TextBlob(x).sentences))
    df_reviews['subjectivity'] = df_reviews['reviewText'].apply(lambda x: TextBlob(x).sentiment.subjectivity)
    df_reviews['words_per_sentence'] = df_reviews.len_words / df_reviews.len_sentences
    df_reviews['sentence_complexity'] = df_reviews.reviewText.apply(lambda x: float(len(set(TextBlob(x).words))) / float(len(TextBlob(x).words)))
Ok, so what I’m doing with all of the above is using TextBlob to extract information from each review. The things I hypothesized that would be interesting are polarity of the reivew, subjectivity, number of words, number of sentences, words per sentence, and sentence complexity. I’m just going to provide the code for some basic charts below, but I encourage you to play around with all the variables and find your own stories to tell!
# these top two plots are not shown below
df_reviews.plot(kind='scatter', x='percent_helpful', y='len_sentences')
df_reviews.len_words.hist(bins=200)
# these two plots are shown below
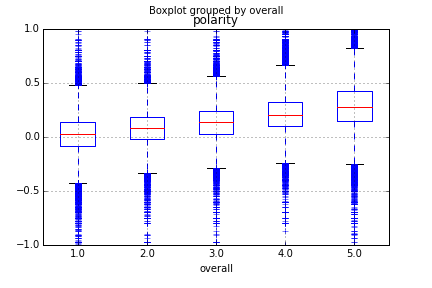
df_reviews.boxplot('polarity', 'overall')
# bubbleplot with colour based on a feature and size based on another feature
plt.figure(figsize=(20,10))
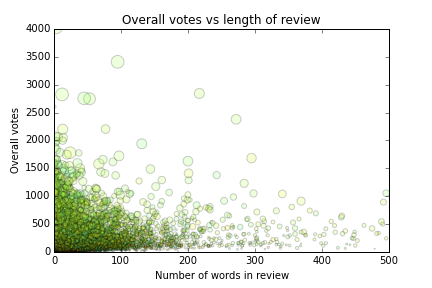
plt.scatter(df_new2.overall_votes, df_new2.time_from_first_review, c=df_new2.sentence_complexity, s=df_new2.len_words, alpha=.2)The first plot below can show you how review polarity changes depending on a user’s rating of the product. The second plot shows how you can create a scatterplot, but incorporate more than 2 features. This one plots number of words in the review vs the overall votes that review received. The colour is based on the polarity of the review and the size of the bubble is based on the number of sentences.
Ok, well, that should be enough to get you up and running! Tune in next week when I discuss how I actually plan to classify a review as helpful or not based on some popular machine learning techniques such as random forests, SVMs, and naive bayes classifiers.
~ Trevor