

Pivot.
We had a talk recently about lean startups and one of the themes was the ability to pivot. This week I had to do exactly that!
In my last post I detailed how to read in Amazon reviews data in Python and how to engineer some basic features. I had planned to use features about the review length and sentence structure in order to classify whether other users would find your Amazon review helpful or not. This was working OK, but I knew that there was a wealth of data in the actual review that I was not capturing in my analysis. Not having any natural language processing training, I didn’t really know where to start, so I did what any sane person would do; GOOGLE it.
Transforming our data
I came across quite a few different tutorials across the web, but ultimately decided to implement what is called a ‘Bag-of-Words’ approach. What this approach does is looks through all of my review text and it creates a sparse matrix of all the words. Then your classification algorithm of choice can treat each of these words as a feature. Let’s look at an example.
Example
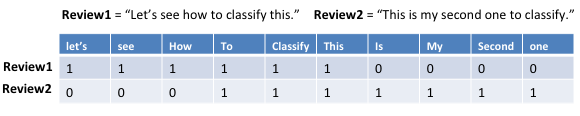
Ok, so we can see that we have two sentences above. The first one contains six words, all of them unique. The second sentence contains seven words, but there are three words that we saw in the first sentence so no additional columns need to be created for those three words. Now that we have reviewed all our of reviews and put together a unique word list, we now have to go back and start filling in our matrix. The next part of the process just involves going through each review and seeing if it contains the word in the first position of our matrix. If yes, then we put a 1, if not, then we put a 0. Then move on to the next word in our matrix and do the same process. After this has been done for one review, then we move to the next review and do the same thing. Sounds daunting right?? Thanks to Python, it isn’t!
"""As a good data scientist, let's first split our data into a training set and test set.  I've chosen an 80/20 split"""

from sklearn.cross_validation import train_test_split
df_train, df_test = train_test_split(df_reviews, test_size=0.2, random_state=0)

"""Ok, now that we have our data split into training and test, let's create our word matrix!  We do this by importing the CountVectorizer function"""

from sklearn.feature_extraction.text import CountVectorizer
X_train = vectorizer.fit_transform(df_train.reviewText)

"""What this just did is used our training data and created the word matrix.  Now the next step is to apply this matrix to our test data set.  If the word wasn't seen in the training data set, then it won't be in our word matrix we create for our test data set"""

X_test = vectorizer.transform(df_test.reviewText)
Testing the models
Alright! Using the above code we were able to create a word matrix from our training data, and then apply that same word matrix to our test data set. Now that we have our data in order, it is time to start fitting some models! For this project I tested all of the typical classification algorithms such as Naive Bayes, Logistic Regression, Support Vector Machimes, and Random Forests. What we want to do is use our training data to fit our model. Then once we have a model that has been trained, we test that on our test data! Remember, our model has not seen our test data at all so this is the moment of truth to see how effective it is at classifying data that it has not seen before. Feel free to skip the code below and just move on to the next section.
"""standard imports"""
from sklearn.linear_model import LogisticRegression

def logistic():
    lg = LogisticRegression()
    lg.fit(X_train, df_train.reviews_helpful)
    lg_pred = lg.predict(X_test)
    lg_score = lg.score(X_test, y_test)
    return "Logistic Regression accuracy: " + str(nb_score)

logistic()
What did we find out?
Now that we have run this, what did our results tell us? Well, the accuracy score of Logistic Regression on my data set was ~76%! That’s pretty good I’d say and I was pleased with that number. I know that number can be improved (will talk about that more next post), but that’s a great accuracy rate for a relatively simple model without any extra features I had engineered in my first Amazon post. But as you all know, accuracy is not the end all for determining model effectiveness. In walks our friends Precision and Recall
-
Precision: What percentage of our predicted helpful reviews are actually helpful reviews? Aka, when our model says that a review is helpful, what percentage of the time is it actually hepful?
-
Recall: What percentage of helpful reviews did we actually catch with our model? Example, if there were 1,000 helpful reviews, how many of them did we correctly identify as helpful?
As you can see from the above, there are subtle differences between precision and recall. In classifying whether a review was helpful or not, I found it most heplful to optimize towards accuracy and precision, not accuracy and recall. The intuition behind this is because if we are analyzing a specific review, we want to be as certain as possible when our model says that it is either helpful or it is not. In other words, we want to minimize the number of false positives that our model supplies. It would be bad for the model to just say that every review is helpful and thus, the recall be 100%. Our false positive rate would be very high and precision would suffer.
Visualizing the results
Since error classification is so important, I created a nice d3 visualization that allows you to see how different models perform under different amounts of training data. You’ll see that the % of training data is plotted along the x-axis, the accurarcy score is plotted along the y-axis, and the size of the bubble is governed by the precision. Below is a static image, but I’ll be working on hosting a web version shortly.

This is a great visualization to see how training size affects accuracy, precision and recall scores, but it doesn’t provide anything actionable for the user. And to that I say, stay tuned for next week! I’m in the process of building a web app where a user inputs their review, clicks calculate, and out pops whether the model thinks your review will be helpful to other users or not! It will also show you which words are most and least helpful in your review (perhaps version 2? :P ). Anyways, enough about bag of words for now! Next week I’ll be refining my model to make the classifications even better.
~ Trevor